STUDY GROUP
INFOGRAPHICS | 2015
Turning Research into Visual Narratives
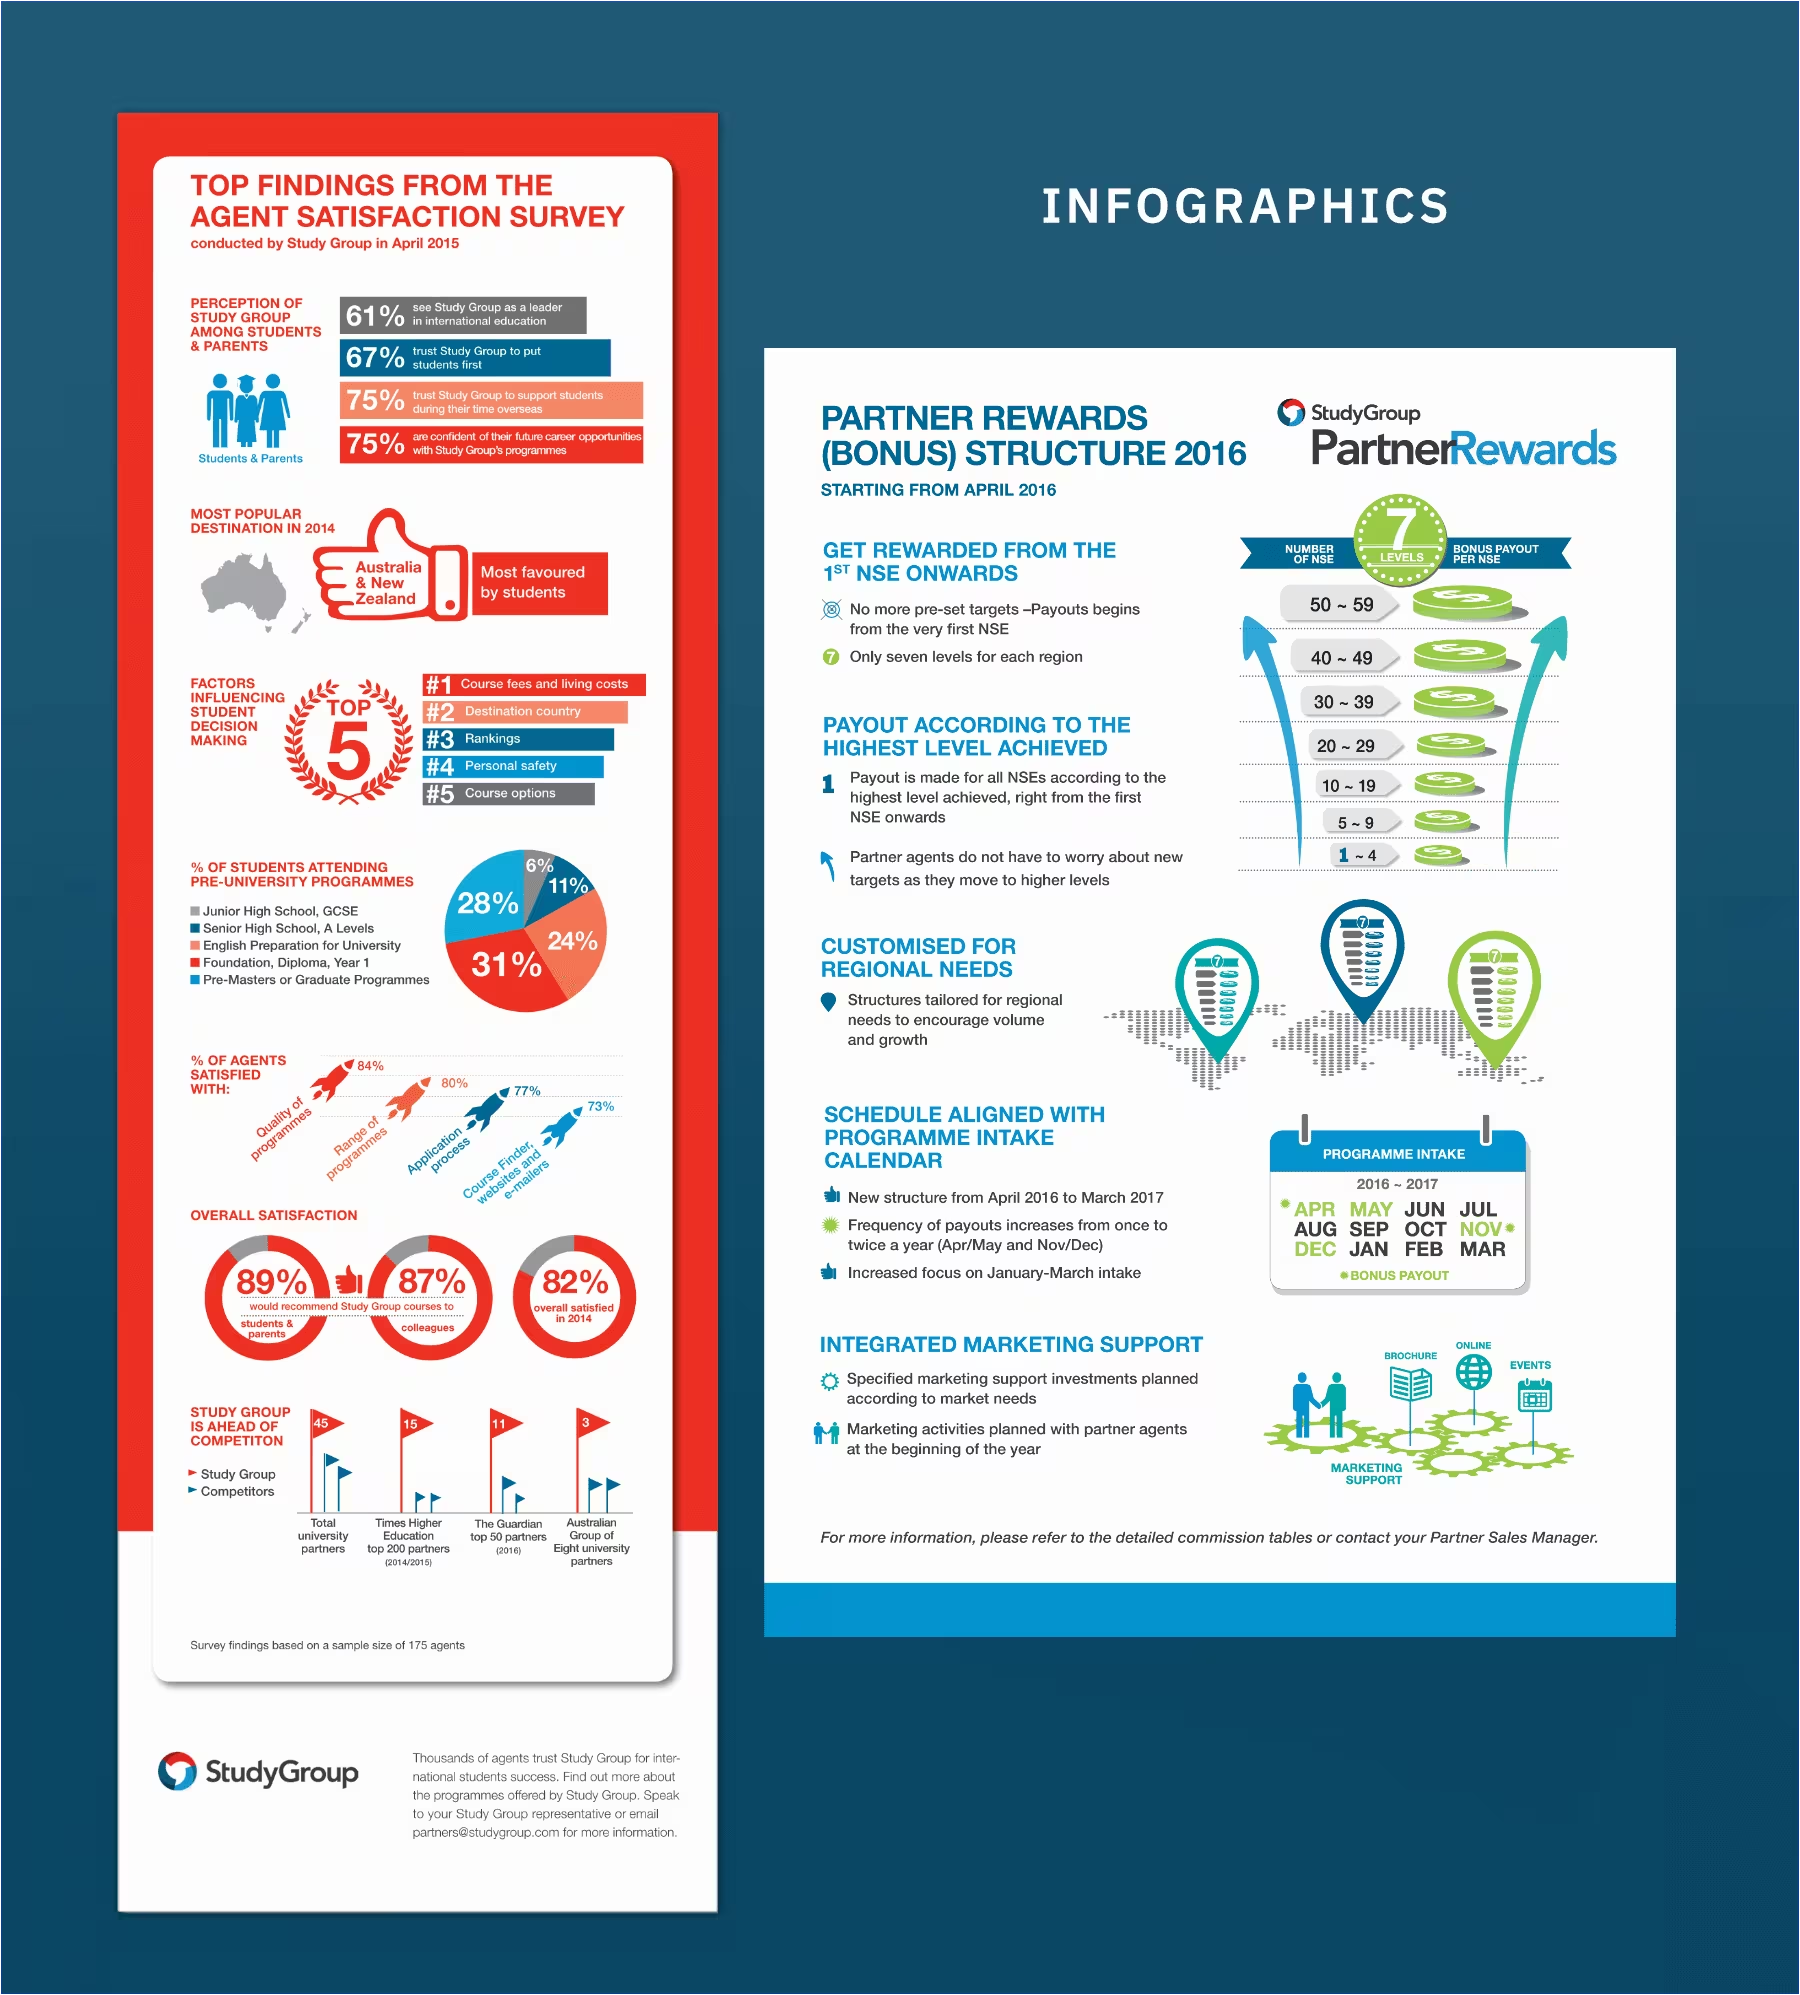
Numbers, facts and findings become far more engaging when they are presented visually. Through a thoughtful blend of icons, illustrations, charts and information hierarchy, infographics transform complex information into stories that are easier to navigate, understand and remember.
Study Group, a global leader in preparing students for international academic success and rewarding careers, commissioned us to visualise their survey findings and editorial features. By carefully distilling the research into a series of engaging infographics, we helped readers absorb key insights at a glance while bringing clarity, rhythm and visual interest to every page.
Because the most effective infographics transform complex information into visual narratives that are engaging and easy to understand.
TESTIMONIAL
“I got to know Marcus from Ease Communications from my previous job and have worked together for a handful of projects. I have always been impressed by the speed and quality of his work. He goes the extra mile for his clients, often under stringent requirements (such as limited budgets and tight timelines) to deliver his best effort. I can always trust Marcus as my valued partner.”
Ms Lau Ying Li
B2B Marketing Specialist,
Study Group